Collectl: Advanced Monitoring Tool for Linux
Leave a comment on Collectl: Advanced Monitoring Tool for Linux
The primary responsibility of a Linux system administrator is to guarantee the proper functioning of the system under their control. Various tools are available for Linux system administrators to monitor and visualize processes, including top and HTOP, but none of these tools can rival the master tool called Collectl.
Collectl – Linux System Performance Monitoring
Collectl is a highly advantageous command-line tool that can be utilized to gather performance data that indicates the present condition of a system. Unlike many other monitoring tools, collectl doesn’t focus on just a few system metrics; instead, it can collect data on a wide range resources of system such as CPU, DISK, NETWORK, MEMORY, SOCKETS, INODES, TCP, CLUSTER, INFINIBAND, MEMORY, PROCESSES, QUADRICS, NFS, BUDDYINFO, AND SLABS.
One distinctive aspect of utilizing collectl is that it can serve the same functions as other specialized utilities such as top, ps, iotop, and various others. Therefore, what are some characteristics that contribute to collectl’s usefulness? Let’s examine them.
The following are some of the most amazing features of the collectl command-line utility for your consumption.
Here are some key points regarding Collectl’s features:
- Collectl can run interactively, as a daemon, or both.
- It provides output in various formats.
- It is capable of monitoring almost any subsystem.
- It can perform the functions of multiple other utilities, such as top, ps, vmstat and iotop.
- It can record and playback captured data.
- It can export data in multiple file formats, which is useful for external analysis.
- It can operate as a service to monitor remote machines or even a server cluster.
- It can display data in the terminal and write to a file or socket.
How to Install collectl in Linux
Collectl is compatible with all Linux distributions and requires only Perl to run. Therefore, it is important to confirm that Perl is installed on your machine before installing collectl, as it typically comes pre-installed.
Install Collectl in Debian-based Systems
The following command can install the collectl utility in Debian-based distributions like Ubuntu and Linux Mint:
sudo apt-get install collectlInstall Collectl in RHEL-based Systems
The following command can install the collectl utility in RedHat-based distributions like Rocky Linux, AlmaLinux, and any other Linux distribution. Just download the tarball, unpack it, and execute it as demonstrated below:
wget https://sourceforge.net/projects/collectl/files/latest/download -O collectl.tar.gz

tar -xvf collectl.tar.gz

cd collectl-*

./INSTALL
Using Collectl Monitoring Tool in Linux
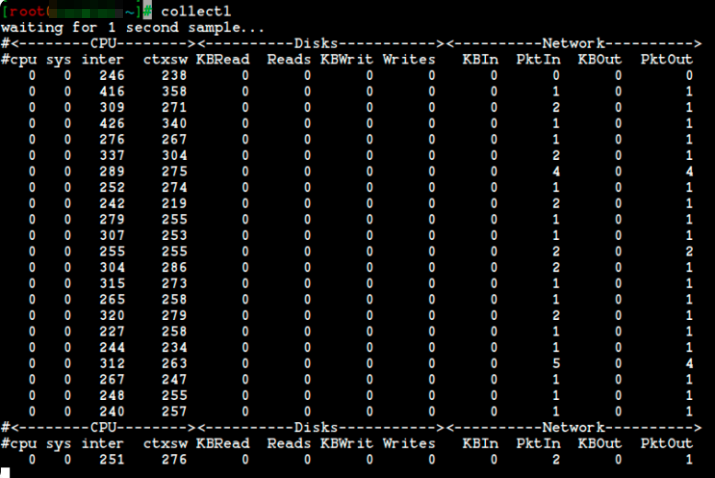
After completing the installation of collectl, you can use it directly from the terminal without any additional options. The following command will present information on CPU, disk, and network statistics in a concise and easily comprehensible format.
collectl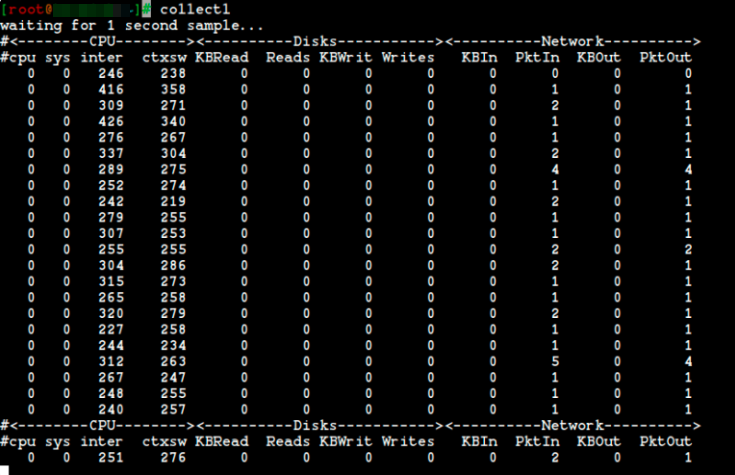
Collectl – Linux System Performance Monitoring
The output shown on the terminal screen above demonstrates that it is straightforward to handle the system metrics values provided in the command output, as they are presented in a single line.
When the collectl utility is executed without any options, it then displays information about the following subsystems:
CPU
Disks
Network
Note: In our case, a subsystem is every type of system resource that can be measured by you.
To display statistics for all subsystems except for slabs, you can use the –all option in conjunction with the command, as illustrated below:
collectl --all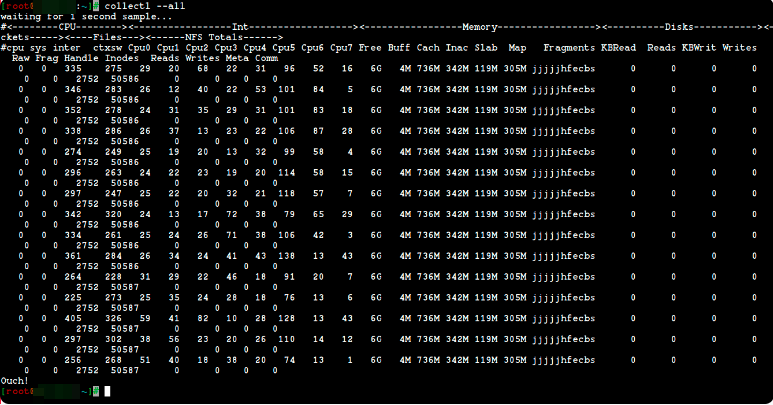
Collectl – Monitor System Statistics
To monitor CPU usage using this utility, you can use the -s option to specify which subsystem data should be collected or played back.
For example, the below-given command can be used to monitor the summary of the cpu usage.
collectl -sc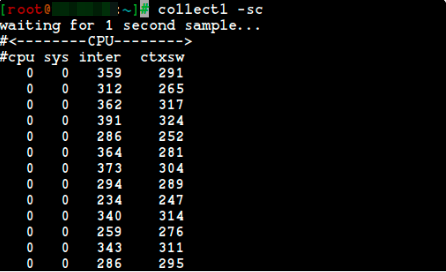
Collectl – Monitor Linux CPU Usage
If you combine the command with “scdn,” what will happen? The most effective method of becoming skilled at using command-line tools is to practice frequently, so execute this command in your terminal to observe the result:
collectl -scdn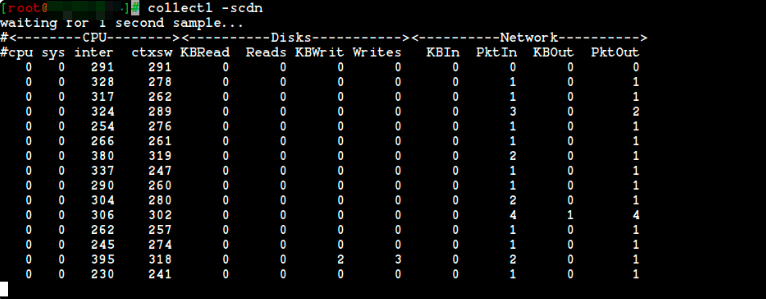
Collectl – Monitor Linux Performance
It is easy to understand that the default option is “cdn,” which represents CPU, disks, and network data. The command’s output is identical to the result of “collectl -scn”
To gather data regarding memory, utilize the command provided below:
collectl -sm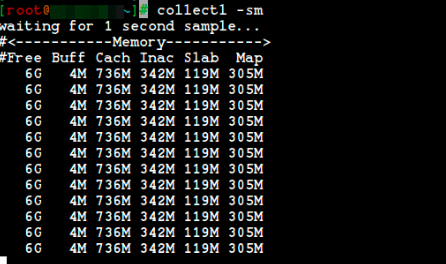
Collectl – Monitor Linux Memory Usage
The output shown above is very useful if you need detailed information regarding your memory usage, available memory, and other crucial factors that impact your system’s performance.
To collect data on TCP, you can use the following command:
collectl -st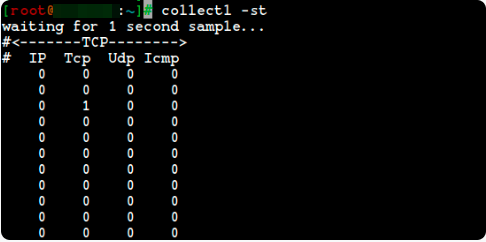
Collectl – Monitor TCP Statistics
As you become more familiar with using collectl, you can easily combine options to obtain specific results. For instance, you can use “t” for TCP and “c” for CPU. This command demonstrates how to do this:
collectl -stc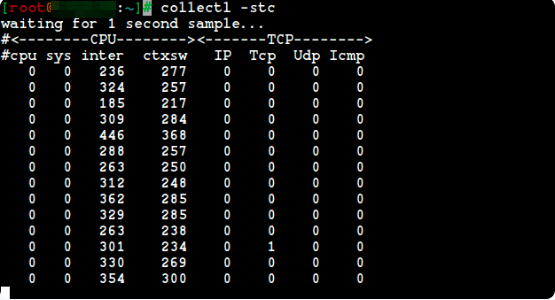
Collectl – Monitor TCP CPU Usage
Here is a summary list of subsystems that are supported by the tool, as it can be difficult for us to remember all available options:
b – buddy info (memory fragmentation)
c – CPU
d – Disk
f – NFS V3 Data
i – Inode and File System
j – Interrupts
l – Lustre
m – Memory
n – Networks
s – Sockets
t – TCP
x – Interconnect
y – Slabs (system object caches)
Monitoring your disk usage is a crucial part of managing your system, especially for system administrators and Linux users. Run the below command.
collectl -sd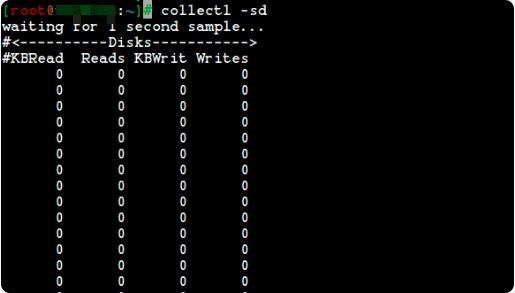
Collectl – Monitor Disk Space Usage
You may also gather information about individual disks using the “-sD” option, but keep in mind that it won’t provide information on the total number of disks.
collectl -sD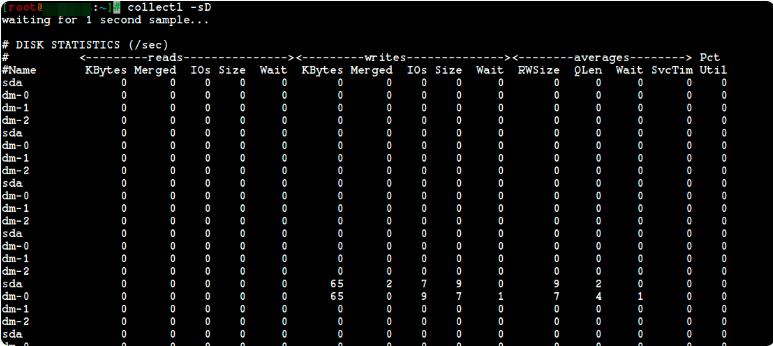
Collectl – Monitor Disk Usage Individually
Furthermore, there are other subsystems that can be used to gather detailed information. The list below provides the names of these subsystems:
C – CPU
D – Disk
E – Environmental data (fan, power, temp), via ipmitool
F – NFS Data
J – Interrupts
L – Lustre OST detail OR client Filesystem detail
N – Networks
T – 65 TCP counters only available in plot format
X – Interconnect
Y – Slabs (system object caches)
Z – Processes
The collectl utility provides several options, but it’s not possible to cover them all in a single article. Nonetheless, it’s important to discuss how to use collectl in a way that is similar to top and ps.
To use collectl as a substitute for the top utility, you can simply run the following command in your terminal. This will produce an output that is the same as what you would see if you executed the top tool on your Linux system.
collectl --top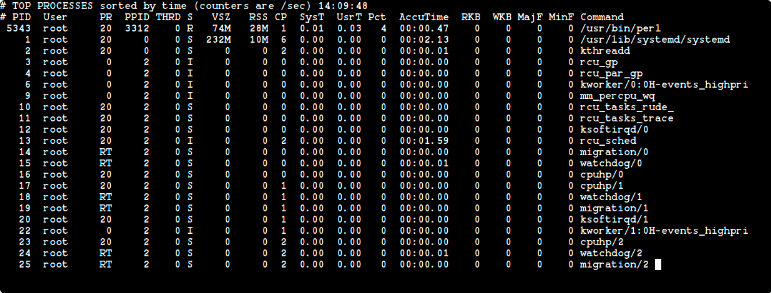
Collectl – Monitor Linux Processes
Finally, to use collectl as the ps tool, simply execute the provided command in your terminal. This will give you details about the processes running on your system, much like what you would see when running the “ps” command.
collectl -c1 -sZ -i:1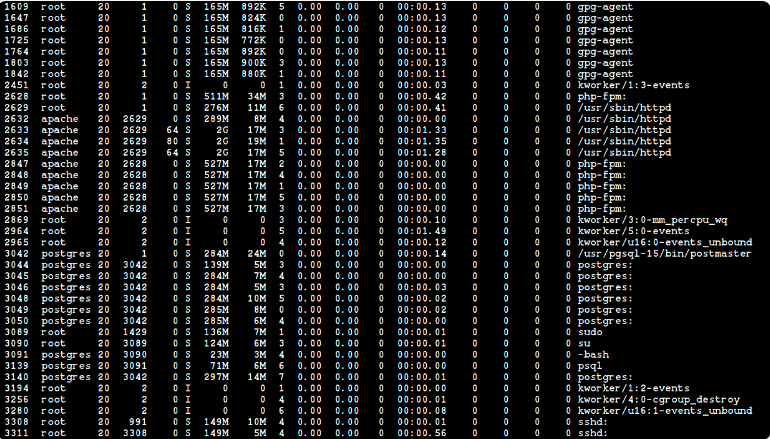
Collectl – Check Linux Process Info
I’m confident that numerous Linux system administrators will find the collectl tool beneficial and will experience its effectiveness when utilizing it to the fullest. If you aspire to expand your knowledge about collectl and continue learning, refer to its manual pages and persist in practicing.
To start reading, simply run the following command in your terminal.
man collectlConclusion
In conclusion, Collectl is an all-in-one system performance monitoring tool for Linux that is highly advantageous for Linux system administrators. It can collect data on a wide range of subsystems such as CPU, DISK, NETWORK, MEMORY, SOCKETS, INODES, TCP, CLUSTER, INFINIBAND, MEMORY, PROCESSES, QUADRICS, NFS, BUDDYINFO, AND SLABS. It has multiple features such as the ability to run interactively or as a daemon, to monitor remote machines or a server cluster, record and playback captured data, export data in multiple file formats, and display data in the terminal and write to a file or socket. It can be installed on any Linux distribution and requires only Perl to run. Collectl is a versatile and powerful tool that can be used for various purposes, making it an essential tool for Linux system administrators.