How to Set Up Real-Time Alerts for Server Failures with Grafana
Leave a comment on How to Set Up Real-Time Alerts for Server Failures with Grafana
Revenue, customer satisfaction, and availability can all be directly impacted by server outages and poor performance. Real-time alerting ensures your operations team is notified immediately when something goes wrong, before users notice. In this guide, you will learn how to configure real-time alerts for server failures using Grafana, backed by reliable metrics from Prometheus.
Why Use Grafana for Server Failure Alerts?
Grafana provides a unified observability layer that combines metrics, logs, and alerts into a single interface. When paired with Prometheus, it enables:
- Near real-time detection of server and service failures
- Flexible alert rules based on metrics, thresholds, and trends
- Multi-channel notifications (email, Slack, PagerDuty, etc.)
- Reduced mean time to detection (MTTD) and resolution (MTTR)
Prerequisites
Before proceeding, ensure you have:
- A Linux server (or VM) to monitor
- Prometheus installed and scraping metrics
- Grafana installed and accessible via browser
- Node Exporter running on target servers
Step 1 – Install and Configure Node Exporter
Node Exporter exposes system-level metrics such as CPU, memory, disk, and network usage.
wget https://github.com/prometheus/node_exporter/releases/download/v1.8.1/node_exporter-1. 8.1.linux-amd64.tar.gz
tar -xvf node_exporter-*.tar.gz cd node_exporter-*
./node_exporter
By default, metrics are available at:
http://<server-ip>:9100/metricsStep 2 – Add Node Exporter to Prometheus
Edit prometheus.yml
scrape_configs:
– job_name: “node_exporter” static_configs:
– targets: [“<server-ip>:9100”]
(make sure to replace “<server-ip>” with your actual server IP) Reload Prometheus and confirm metrics appear in the Prometheus UI.
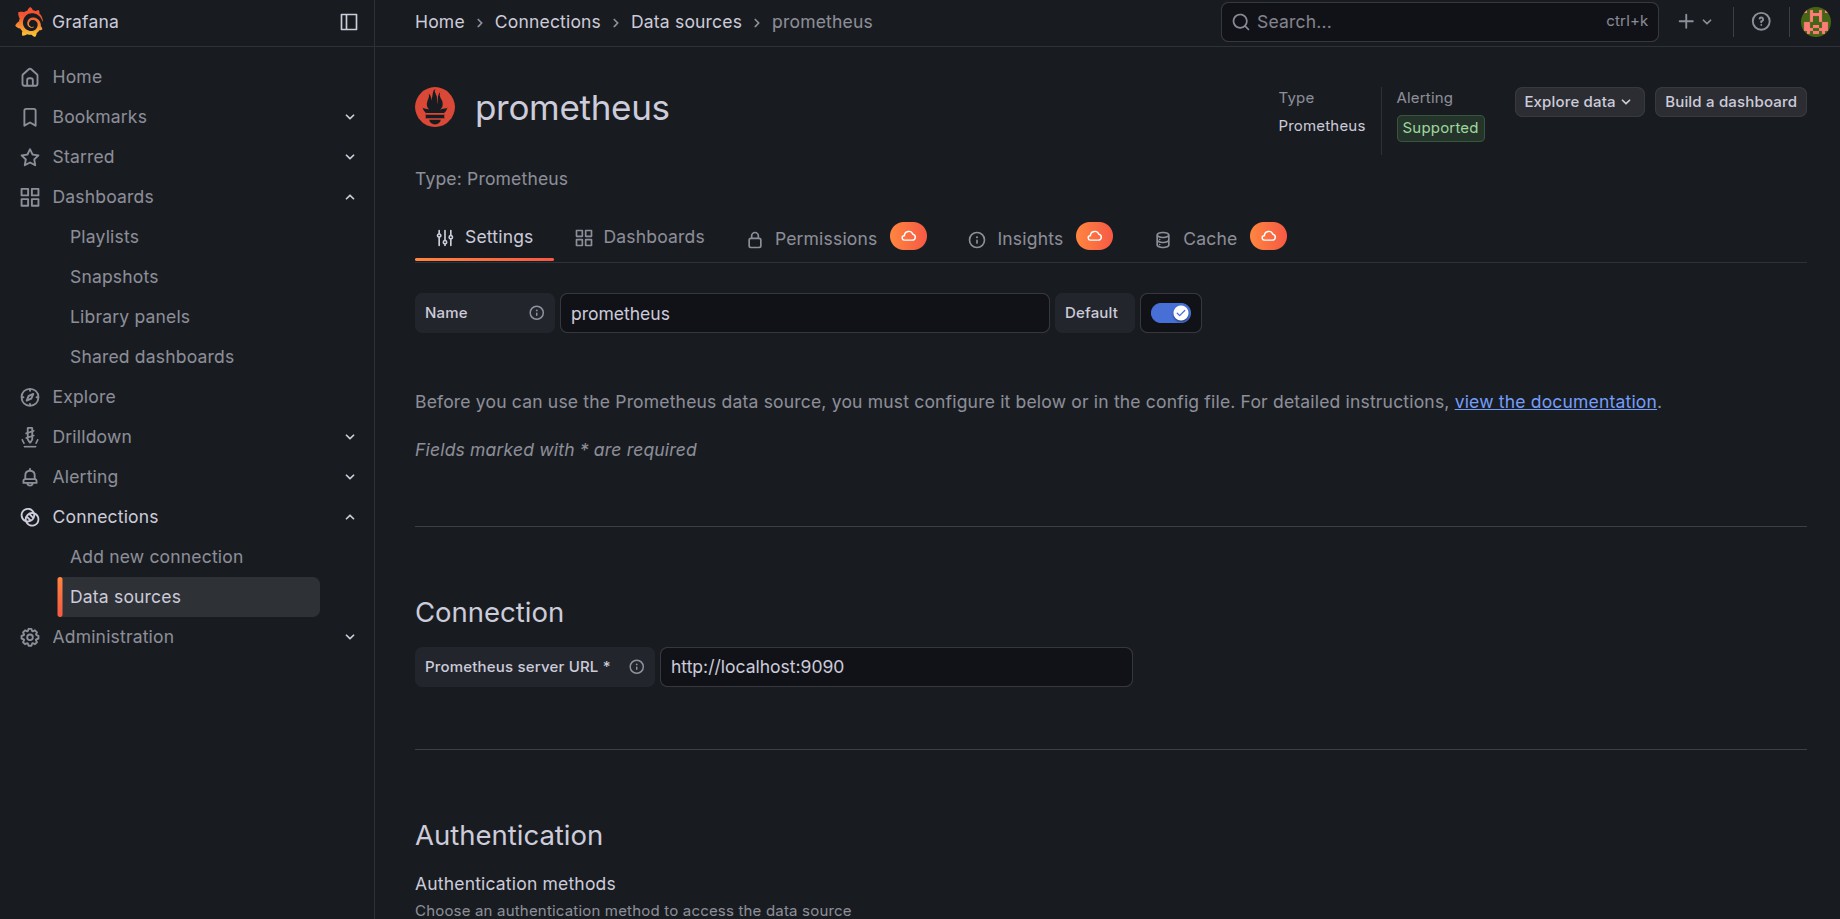
Step 3 – Add Prometheus as a Data Source in Grafana
- Log in to Grafana
- Navigate to Connections >> Data Sources
- Select Prometheus
- Set the URL (e.g., http://localhost:9090)
- Click Save & Test
Grafana is developed and maintained by Grafana Labs, while Prometheus is an open-source monitoring system governed by the Cloud Native Computing Foundation.
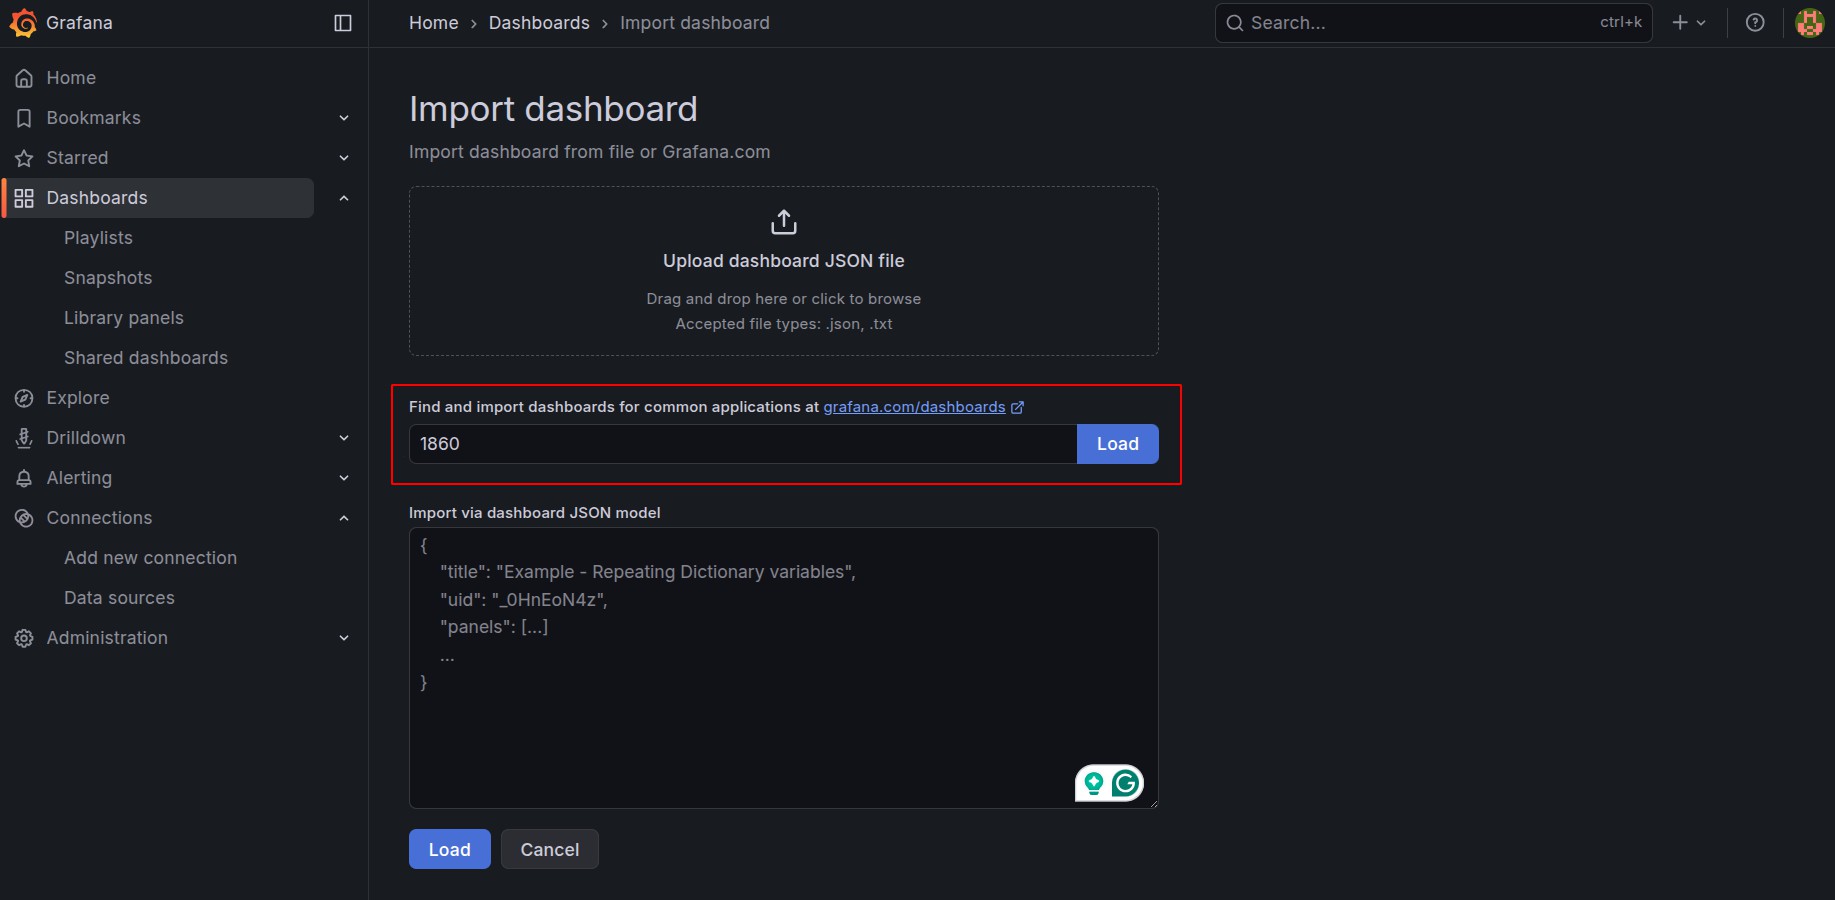
Step 4 – Create a Server Health Dashboard
You can import a ready-made Node Exporter dashboard:
- Dashboard ID: 1860 (Node Exporter Full)
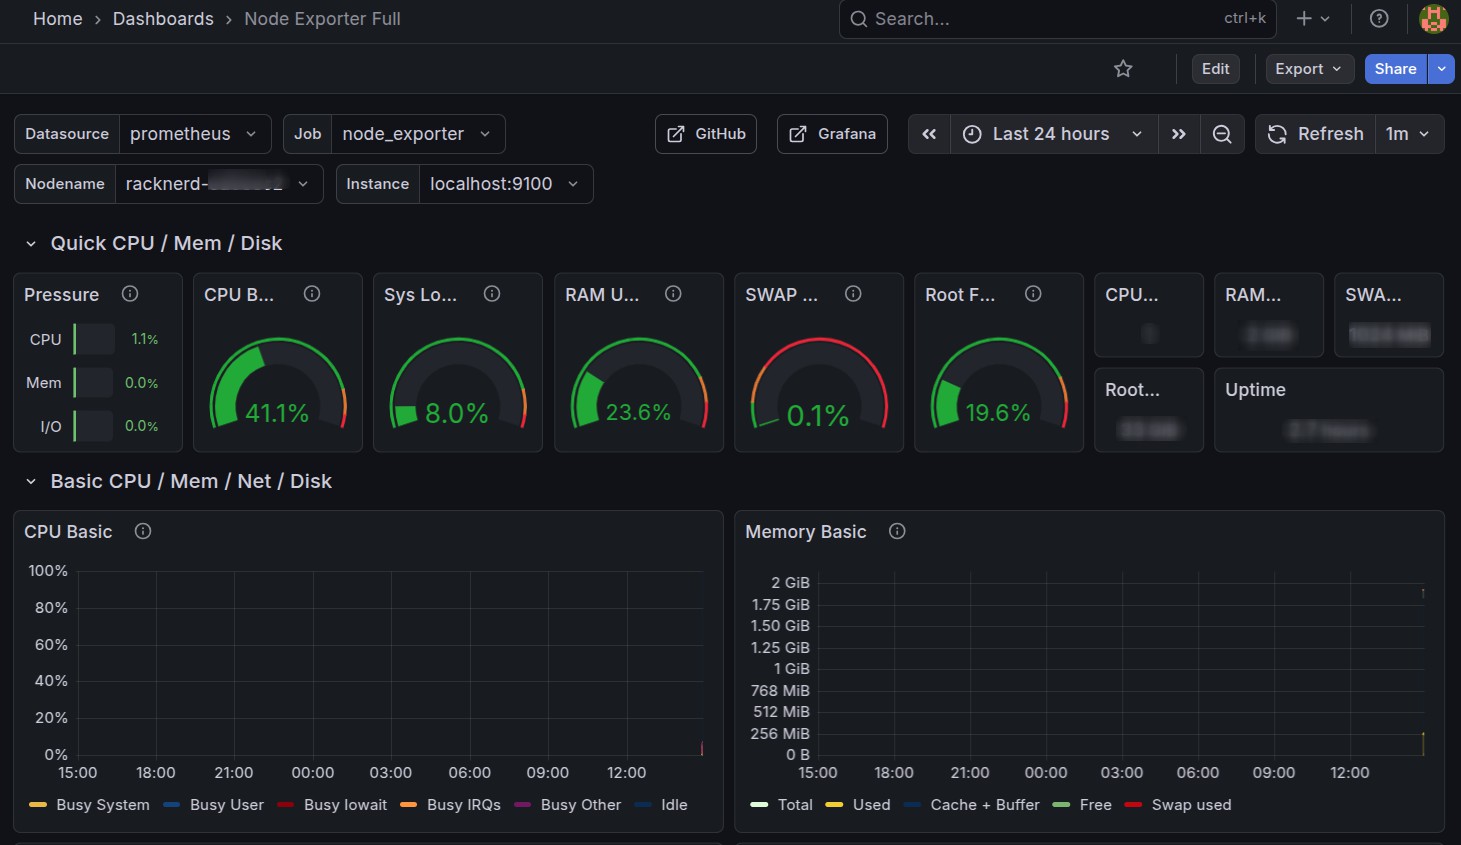
This dashboard provides visibility into:
- CPU usage and load average
- Memory and swap usage
- Disk I/O and filesystem health
- Network throughput
Step 5 – Configure Real-Time Alert Rules
Grafana’s unified alerting allows you to define alert rules directly from dashboards or the alerting section.
Example: Server Down Alert Metric query (PromQL):
up{job="node_exporter"} == 0Condition:
Trigger alert if value is ‘0’ for ‘1’ minute Alert name:
Server Down – Node Exporter Unreachable
Example: High CPU Usage Alert
100 - (avg by (instance) (rate(node_cpu_seconds_total{mode="idle"}[5m])) * 100) > 90Condition:
CPU usage above 90% for 5 minutes
Step 6 – Set Up Notification Channels
Grafana supports multiple notification integrations:
- Slack
- Microsoft Teams
- PagerDuty
- Webhooks
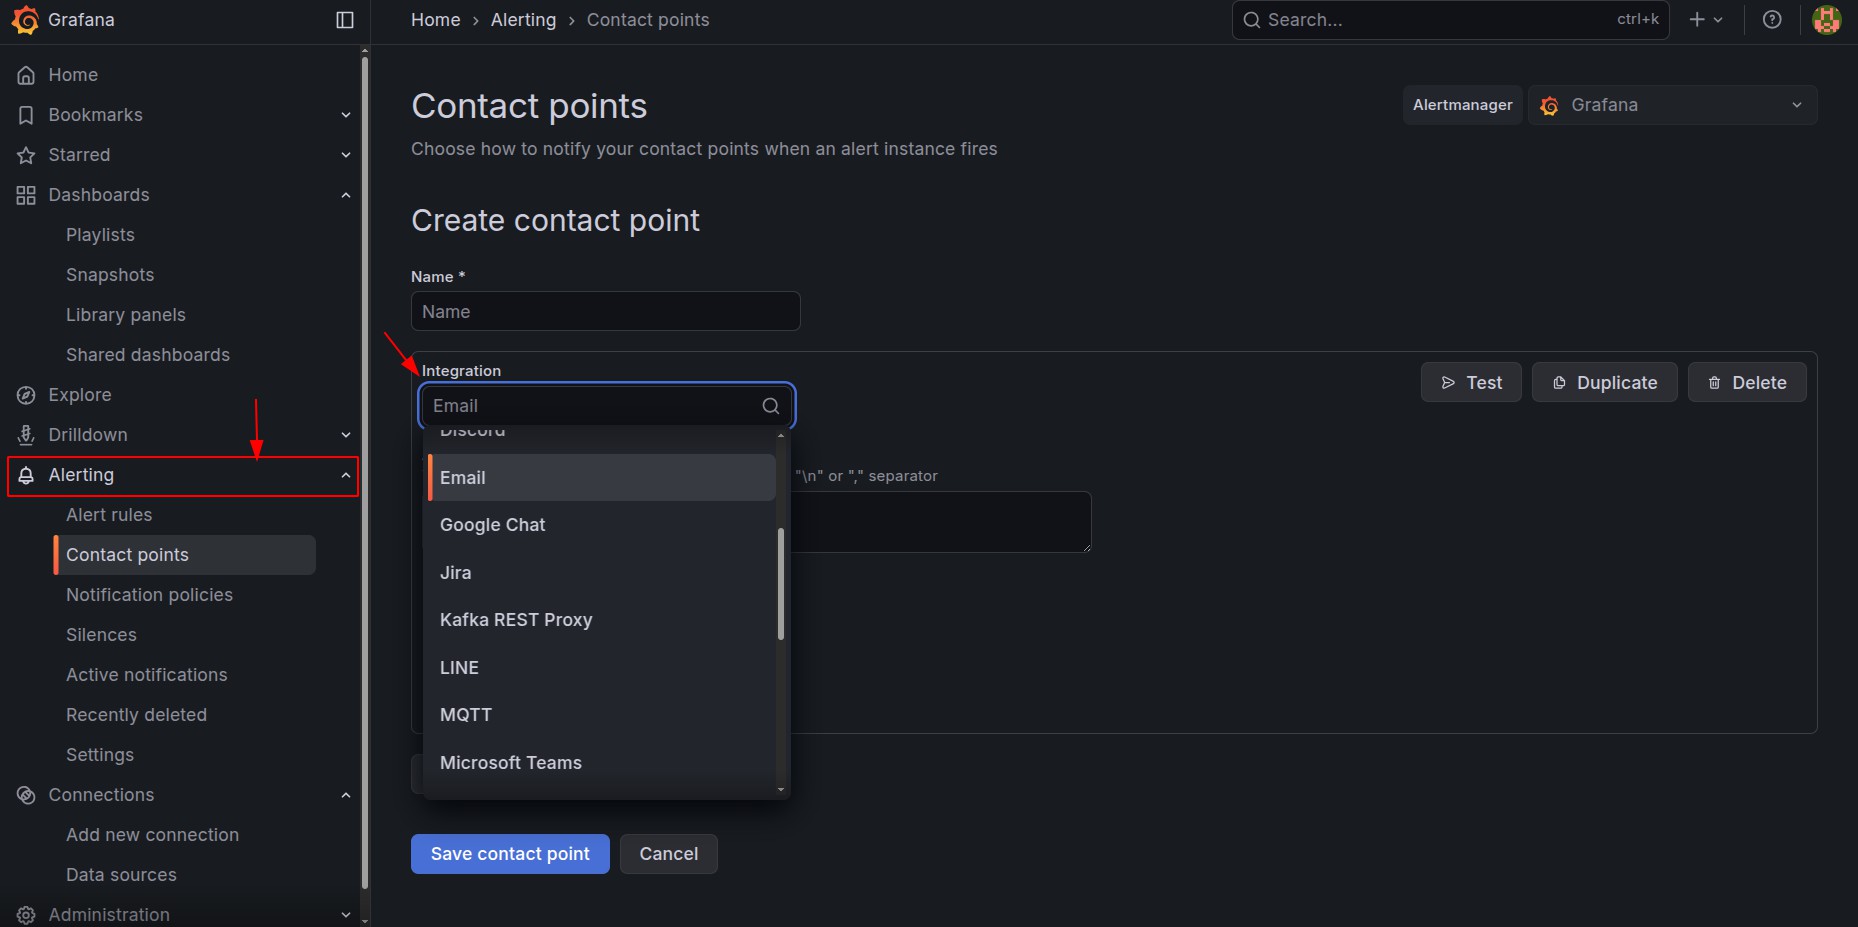 Go to Alerting >> Contact Points, configure the channel, and link it to your alert rule via a notification policy.
Step 7 – Test and Tune Alerts
Before relying on alerts in production:
- Simulate failures (stop Node Exporter or block the port)
- Verify alert firing and notification delivery
- Adjust thresholds to reduce noise and false positives
- Add severity labels (warning vs critical)
Best Practices for Reliable Alerting
- Alert on symptoms, not raw metrics (e.g., service down vs CPU spike)
- Use short evaluation windows for availability checks
- Avoid alert fatigue by grouping related alerts
- Document alert runbooks for faster resolution
- Periodically review and refine alert rules
Conclusion
By combining Prometheus metrics with Grafana’s alerting engine, you can build a robust real-time alerting system for server failures. This setup ensures faster incident response, improved uptime, and greater operational confidence, especially in production and customer-facing environments.