How to Set Up a Centralized Log Management System with ELK Stack
Leave a comment on How to Set Up a Centralized Log Management System with ELK Stack
Without a centralized system, managing logs from several servers and applications can be very difficult.
The ELK Stack (Elasticsearch, Logstash, and Kibana) is a powerful suite of tools that simplifies log aggregation, analysis, and visualization. Here, we will walk you through setting up a centralized log management system using the ELK Stack.
What is the ELK Stack?
- Elasticsearch is a search engine and distributed analytics platform that monitors and indexes log data.
- Logstash: A pipeline for data processing that receives, processes, and sends log data.
- Kibana: A web interface that allows you to visualize and explore logs stored in Elasticsearch.
When combined, these tools provide a strong log management platform for keeping an eye on, debugging, and protecting your system.
Step 1 – Install Java
sudo apt update
sudo apt install openjdk-11-jdk -y
Verify Java installation:
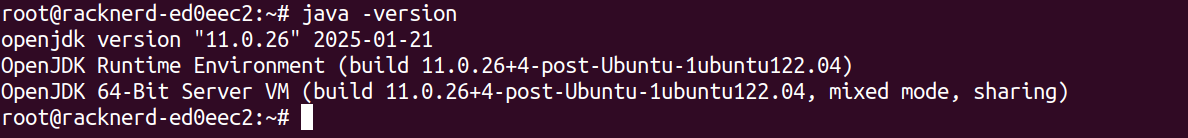
java -version
Step 2 – Install and Configure Elasticsearch
Download and install the Elasticsearch package:
sudo mkdir -p /etc/apt/keyrings
curl -fsSL https://artifacts.elastic.co/GPG-KEY-elasticsearch | gpg –dearmor | sudo tee
/etc/apt/keyrings/elastic-archive-keyring.gpg > /dev/null
echo “deb [signed-by=/etc/apt/keyrings/elastic-archive-keyring.gpg] https://artifacts.elastic.co/packages/7.x/apt stable main” | sudo tee
/etc/apt/sources.list.d/elastic-7.x.list sudo apt update
sudo apt install elasticsearch
Enable and start the Elasticsearch service:
sudo systemctl enable elasticsearch sudo systemctl start elasticsearch
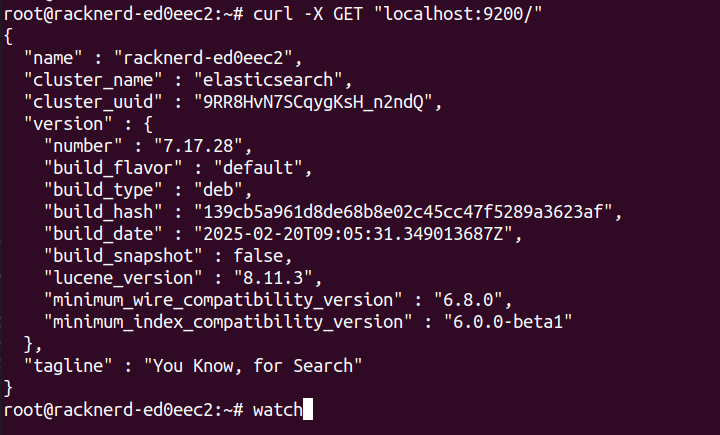
Test Elasticsearch:
curl -X GET “localhost:9200/”
Step 3 – Install and Configure Logstash using:
sudo apt install logstash
Create a basic configuration file:
sudo nano /etc/logstash/conf.d/logstash.conf
Add the following:
input { beats {
port => 5044
}
}
filter {
}
output { elasticsearch {
hosts => [“localhost:9200”]
index => “%{[@metadata][beat]}-%{+YYYY.MM.dd}”
}
}
Start Logstash:
sudo systemctl enable logstash
sudo systemctl start logstash
Step 4 – Install and Configure Kibana
sudo apt install kibana
Edit the Kibana configuration:
sudo vi /etc/kibana/kibana.yml
Uncomment and set the following in the file:
server.port: 5601
server.host: “0.0.0.0”
elasticsearch.hosts: [“http://localhost:9200”]
Start Kibana:
sudo systemctl enable kibana sudo systemctl start kibana
Access the Kibana web interface by navigating to:
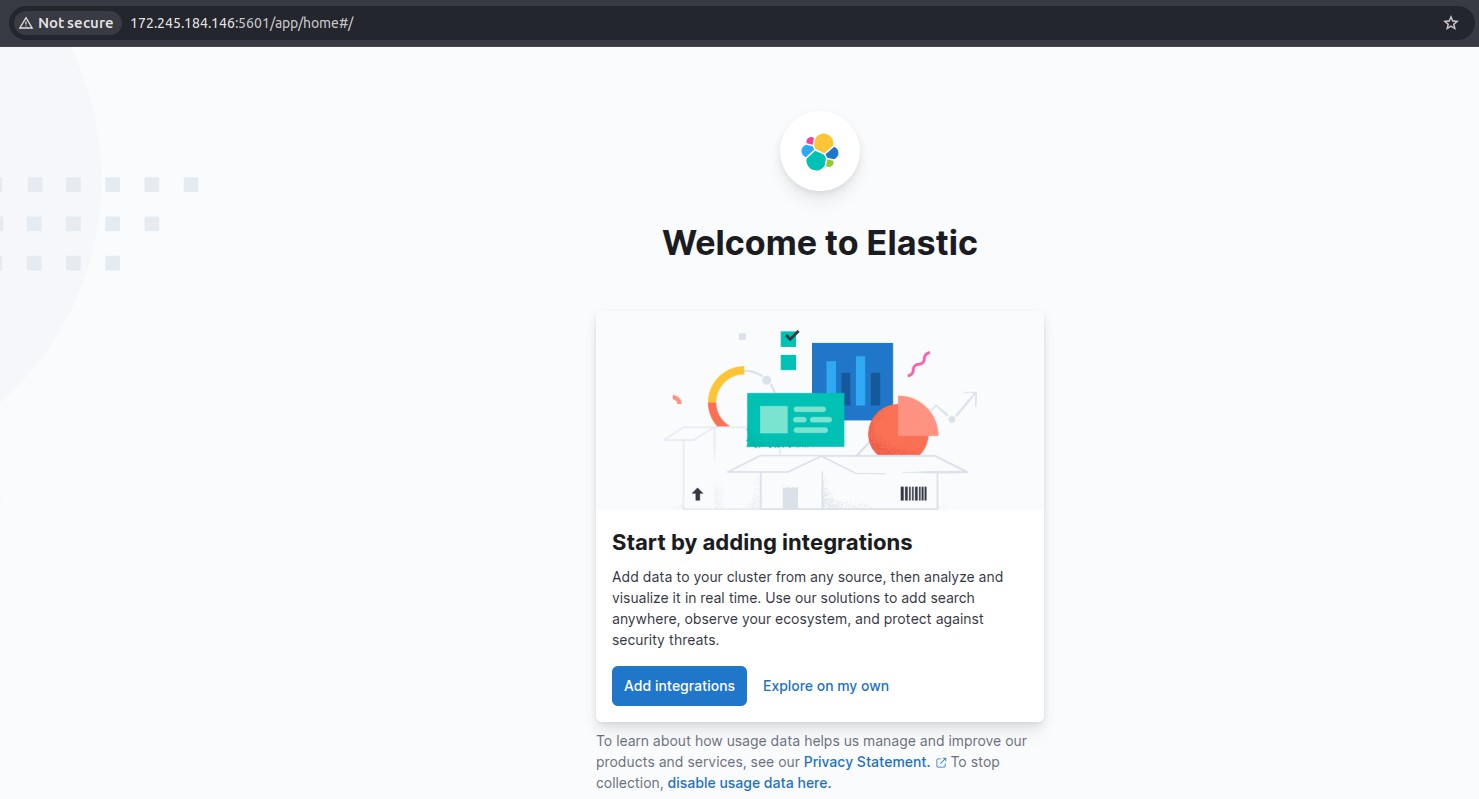
Step 5 – Forward Logs with Filebeat
Install Filebeat on your application servers:
sudo apt install filebeat
Edit Filebeat configuration to send logs to Logstash:
sudo vi /etc/filebeat/filebeat.yml
Modify the output section:
output.logstash:
hosts: [“your-elk-server-ip:5044”]
Enable and start Filebeat:
sudo systemctl enable filebeat
sudo systemctl start filebeat
Step 6 – Visualize Logs in Kibana
- Navigate to the Kibana web interface.
- Go to “Stack Management > Index Patterns”.
- Create a new index pattern (e.g., filebeat-*).
- Select the timestamp field and save.
Now, you can explore logs using Kibana’s Discover, Dashboard, and Visualize features.
Conclusion
Setting up a centralized log management system with the ELK Stack greatly improves your capacity to monitor, analyze, and handle infrastructure issues. With Filebeat sending logs to Logstash and Elasticsearch storing them for Kibana to visualize, you’ll have a comprehensive picture of your systems at your disposal.
To secure your ELK Stack deployment in production, consider enabling SSL/TLS, user authentication, and role-based access.