Analyze the Performance of Your Server or Web Stack with Apache JMeter
Leave a comment on Analyze the Performance of Your Server or Web Stack with Apache JMeter
With shrinking attention spans, a slow-loading website or application will harm conversions and tank your SERP ranking. This makes performance testing a necessary component of software testing, as it ensures the stability of the software and helps identify potential inefficiencies. What you need is a powerful performance testing tool like Apache JMeter. JMeter is an open-source, Java-based performance testing tool. It can measure performance and load-test web applications.
We have put together this article to delve deep into how JMeter works, its key features, and how to create a test plan using it.
What is Apache JMeter?
As we already mentioned, Apache JMeter is an open-source Java application that is used in performance testing. More specifically, it can measure performance and load-test web applications. An added advantage of this tool is that it supports multiple protocols, including HTTP, HTTPS, FTP, and JDBC, making it a versatile tool for testing different types of applications.
How Does It Operate?
JMeter operates by carrying out the test plans you write. Each step that JMeter must perform to send HTTP requests, simulate user interactions, and gather performance metrics will be outlined in a test plan. As you create the test plan, you can adjust multiple parameters according to your needs. You can configure metrics such as the number of users, ramp-up time, and loop count.
All you have to do is create a test plan, and JMeter will simulate a group of users according to the number you have set. Requests will be sent, and response times will be measured. Additionally, metrics like throughput, latency, and error rate will also be provided, and graphs will be generated for you to better analyze the test results. This will allow you to efficiently analyze how your software stands up to various loads.
Steps-by-Step Process:
- Create a test plan.
- Configure user parameters.
- Add test elements.
- Run the test.
- Analyze the results.
Why You Should Use JMeter
Performance testing in general ensures that your application or website has optimal functionality. And JMeter is a versatile tool that lets you efficiently collect performance metrics. Here are some of the reasons why you should use JMeter:
- Helps identify performance bottlenecks.
- Ensures the stability of your software.
- Improves the user experience and satisfaction.
- Assists you in optimizing resource allocation.
- Aids in capacity planning.
Getting Started with Apache JMeter
Armed with that much information, let’s go ahead and get started with JMeter. Follow the steps we have given below and embark on your performance testing journey:
- Download and install the tool from the official Apache JMeter website.
- Create a test plan and experiment with different test elements and configurations.
- Run the test that you created.
- Analyze the results and identify areas for improvement.
Creating a Test Plan
Your test plan is like an outline for the performance test that you are conducting. This outline should contain important parameters and elements like the number of users, ramp-up period, or a Listener. As you create the test plan, follow these steps:
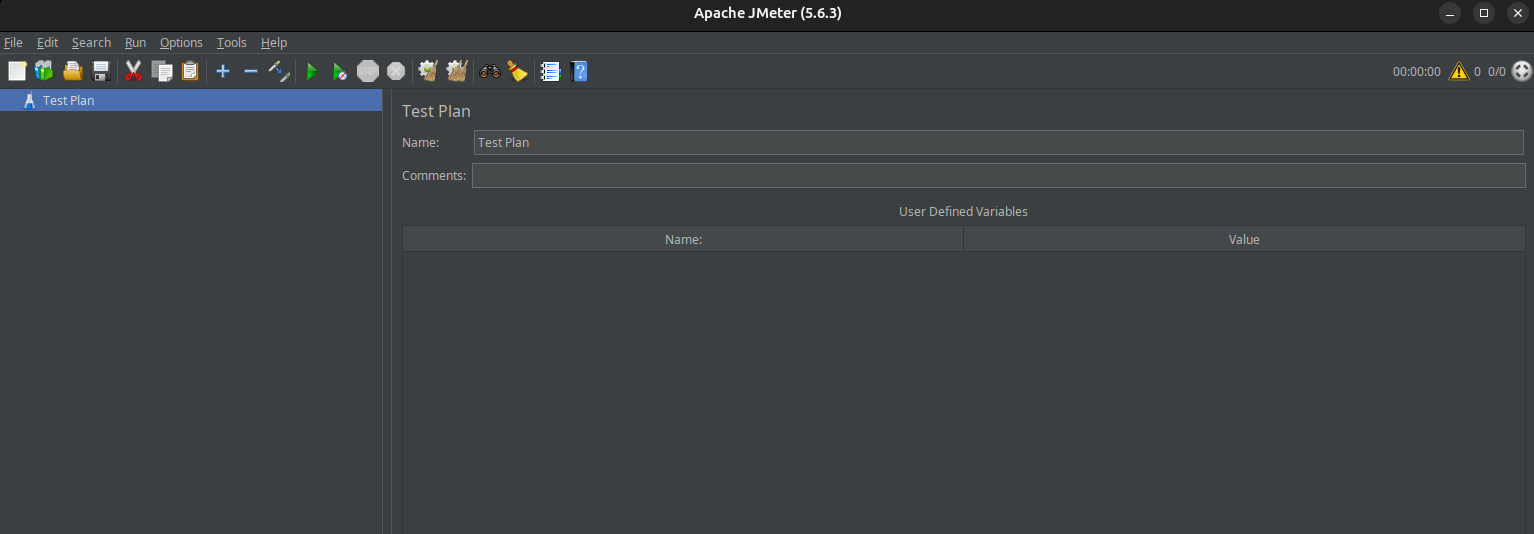
- Open JMeter and locate the Test Plan section. It is located on the left side of the interface in the tree view.
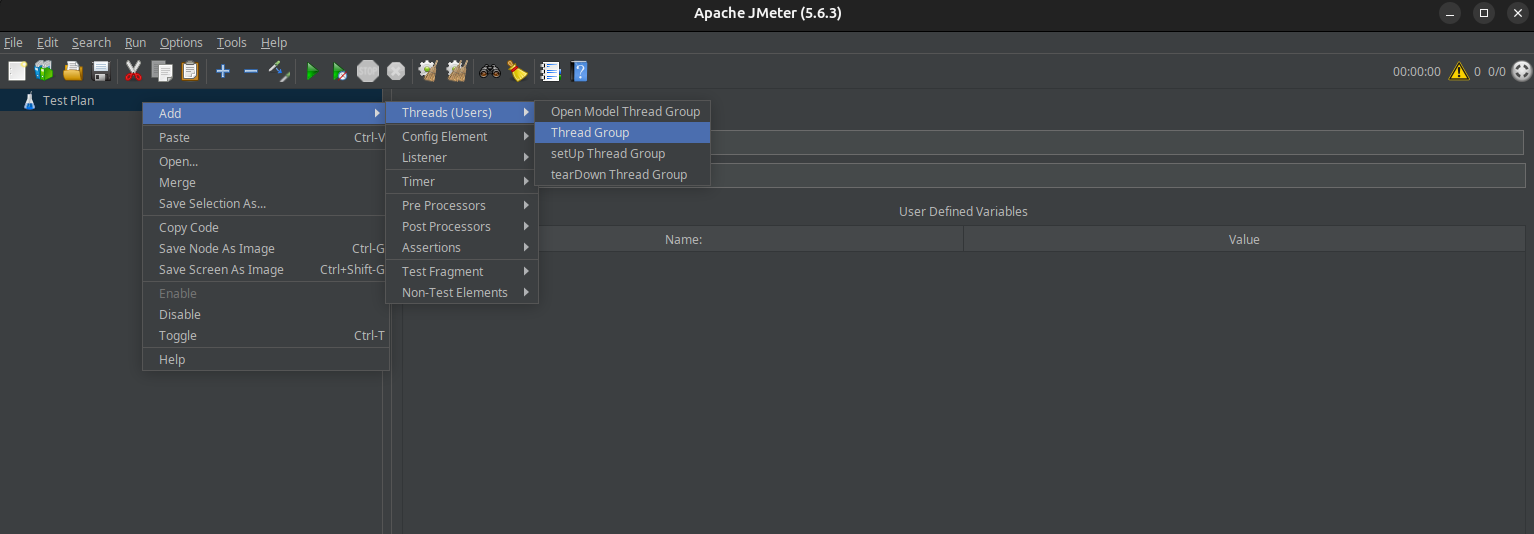
- Click the Test Plan with a right-click, then choose Add > Threads (Users) > Thread Group. Now, you have created a Thread Group. (Think of this as a group of users that JMeter will eventually simulate.
- Configure settings such as the number of threads to simulate, the ramp-up period, and the loop count from the Thread Group panel.
- Now add a Sampler element to the Thread Group by selecting Add > Sampler, as shown in the image. Choose the Sampler type you require.
- Configure the parameters of the Sampler in the Sampler panel. You would be required to specify the URL, HTTP method, request parameters, headers, etc.
- Add a Listener element. Right-click on the Thread Group, and select Add > Listener. This element will help you view the test results. A Listener displays the results in formats like Summary Reports, Graph Results, and View Results Tree. You can choose any of these formats.
- After creating your test plan, click the green arrow in the toolbar to begin the test.
These methods will help you develop a thorough Test Plan in Apache JMeter so you can use it to accurately simulate and analyze the performance of your web applications and servers.
Analyzing the Results
Once the test is completed, you can analyze the results displayed in the Listener panels. To find performance problems and bottlenecks, this entails analyzing metrics like response time, throughput, error rate, and resource utilization.
Conclusion
With no doubt, Apache JMeter is a powerful tool that will help you if providing great user experiences is your top concern. It allows you to identify performance bottlenecks, ensure software stability, enhance user satisfaction, and optimize resource allocation. Its user-friendly interface and extensive reporting tools enable you to carry out exhaustive performance tests and obtain practical insights to promote continuous improvement. Armed with the knowledge shared in this article, you’re well-equipped to embark on your performance testing journey with Apache JMeter.