Exploring Prometheus and Grafana: A Guide for Server Monitoring
Leave a comment on Exploring Prometheus and Grafana: A Guide for Server Monitoring
In the world of IT infrastructure, monitoring server performance is crucial for ensuring reliability, efficiency, and security. Two of the most powerful open-source monitoring tools available today are Prometheus and Grafana.

Together, they provide a comprehensive solution for collecting, storing, visualizing, and analyzing server metrics. This guide will explore their functionalities and show you how to set up and use these tools for effective server monitoring.
What is Prometheus?
Prometheus is a time-series database and monitoring system designed to collect and store metrics from various endpoints. Originally developed at SoundCloud, it has now become a part of the Cloud Native Computing Foundation (CNCF). Prometheus is widely used for monitoring modern cloud environments, microservices, and traditional server infrastructures.
Key Features of Prometheus:
- A pull-based architecture that scrapes metrics from configured endpoints
- A multi-dimensional data model with powerful query capabilities using PromQL
- Built-in alerting with Alertmanager for proactive issue detection
- Efficient storage and scalability, making it suitable for handling large-scale environments
What is Grafana?
Grafana is an open-source analytics and visualization platform that integrates seamlessly with Prometheus and other data sources. It allows users to create dynamic and interactive dashboards to analyze system performance visually.
Key Features of Grafana:
- Customizable dashboards with various visualization options (graphs, heatmaps, tables, etc.)
- Support for multiple data sources, including Prometheus, MySQL, Elasticsearch, and more
- Alerting capabilities with notifications via email, Slack, PagerDuty, etc.
- User-friendly interface for real-time monitoring and troubleshooting
Setting Up Prometheus and Grafana for Server Monitoring
Step 1 – Install Prometheus
Visit the official website to download the most recent version of Prometheus. https://prometheus.io/download/
Extract the package and navigate to the Prometheus directory.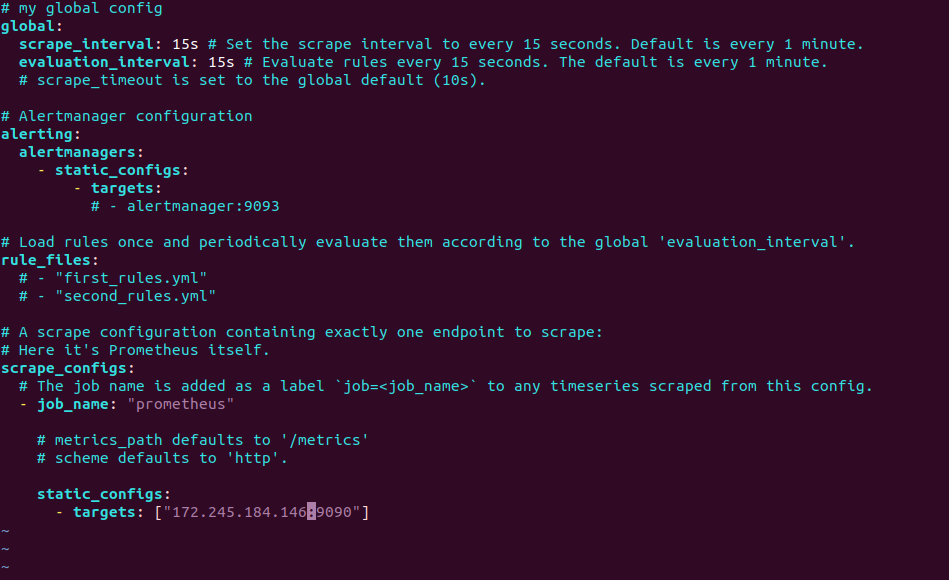 Modify the prometheus.yml configuration file to define scrape targets (e.g., your server or applications).
Start Prometheus:
./prometheus –config.file=prometheus.yml
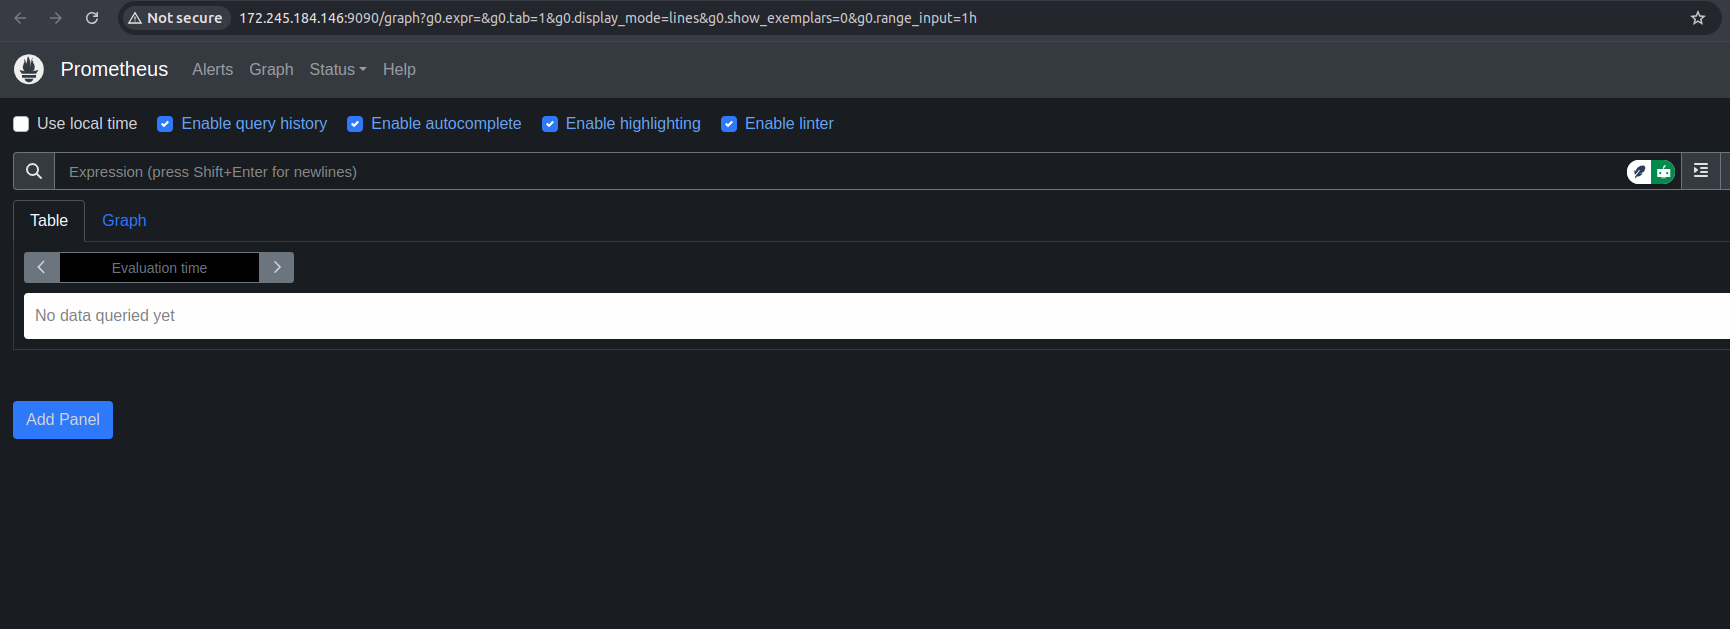
Access the Prometheus web interface at http://localhost:9090 or http://your_IP:9090 to verify that it is running.
Step 2 – Install Grafana
Download and install Grafana from the official website. https://grafana.com/grafana/download/
Start the Grafana service:
sudo systemctl start grafana-server
Open a web browser and go to http://localhost:3000 or http://your_IP:3000
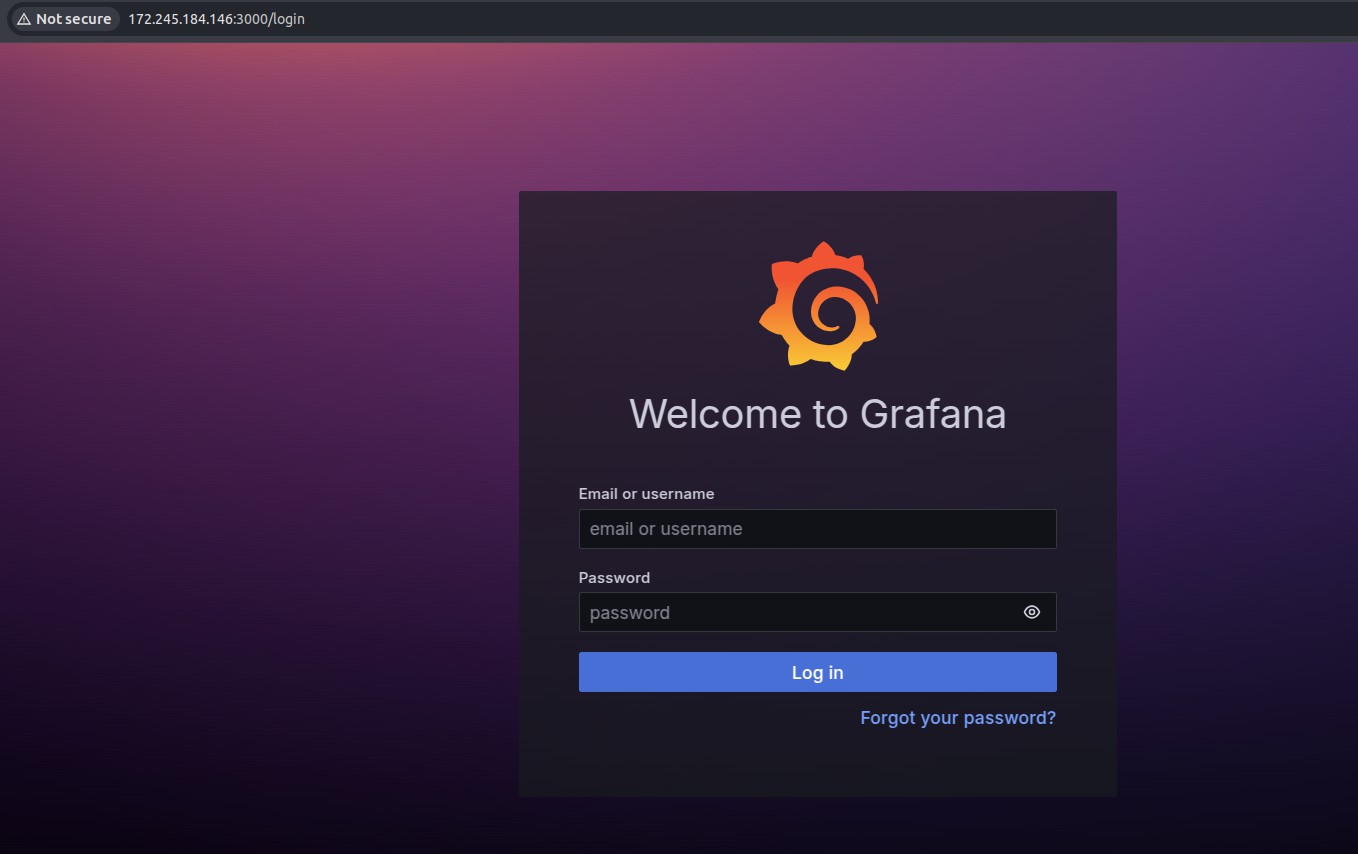
Log in with the default credentials (admin/admin) and update your password.
Step 3 – Connect Grafana to Prometheus
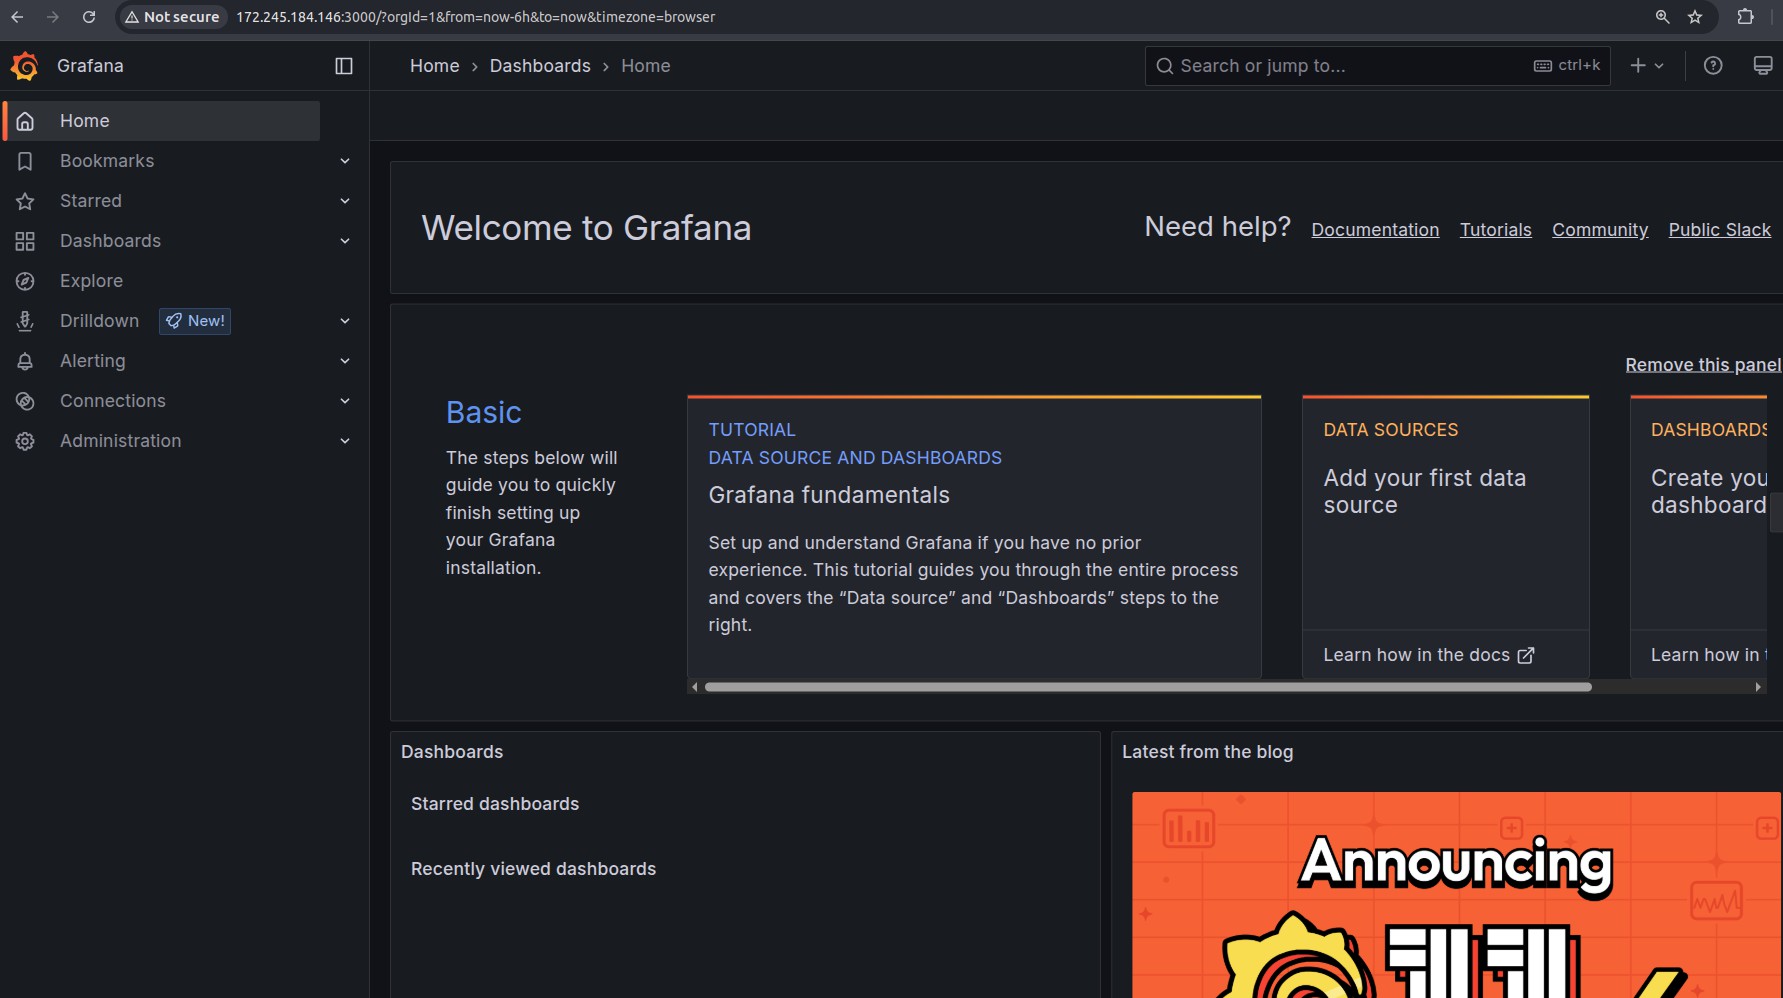
In Grafana, go to Connections > Data Sources.
Click Add Data Source and select Prometheus.
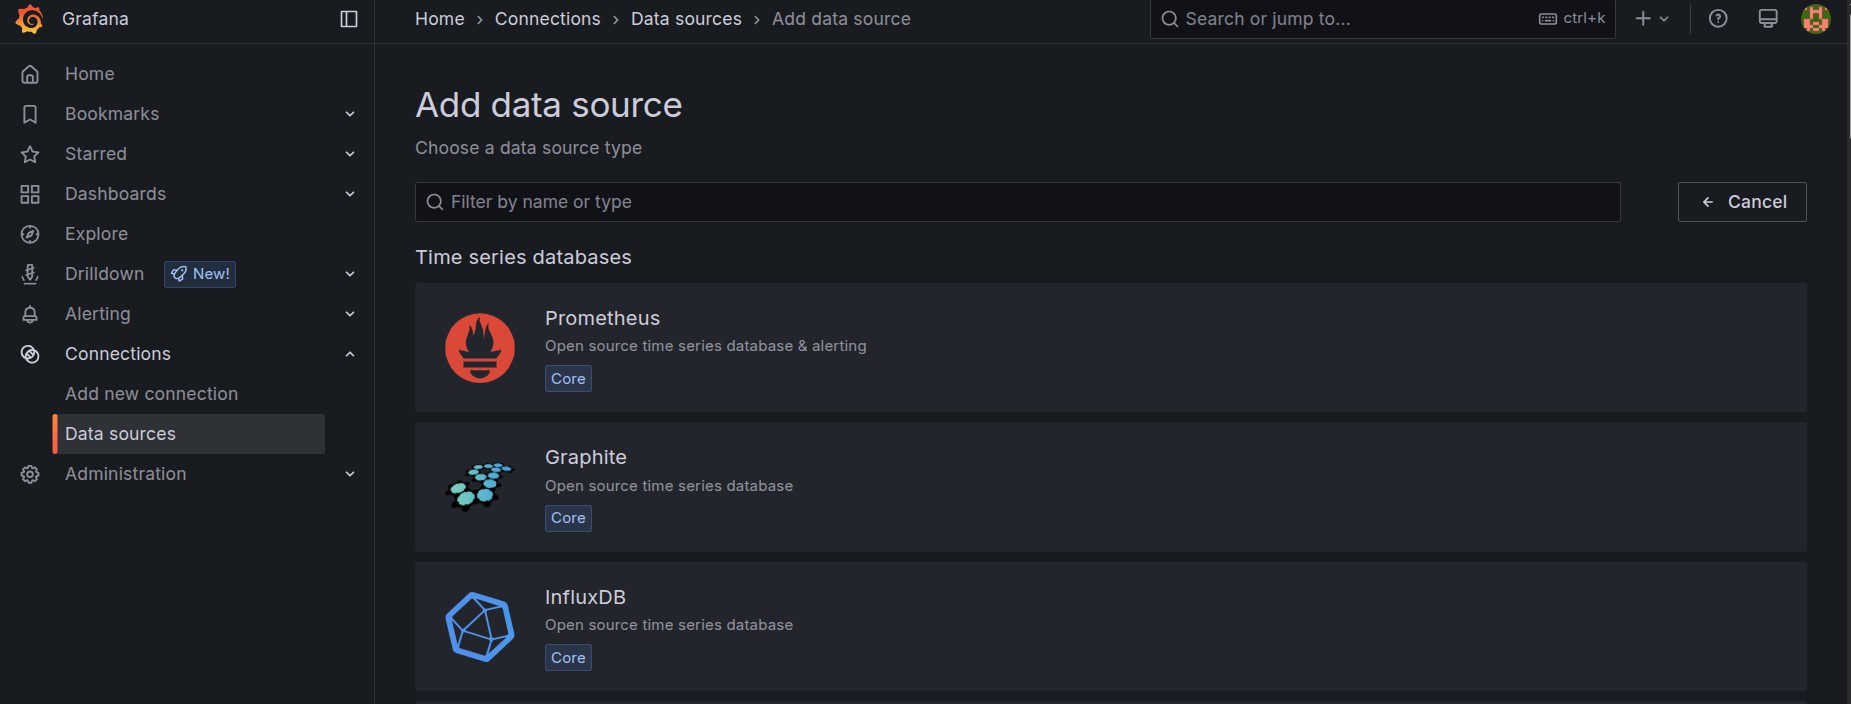
Enter the URL of your Prometheus server (e.g.,http://localhost:3000 or http://your_IP:3000).
Click Save & Test to verify the connection.
Step 4 – Create Dashboards and Alerts
Navigate to Dashboards > New Dashboard.
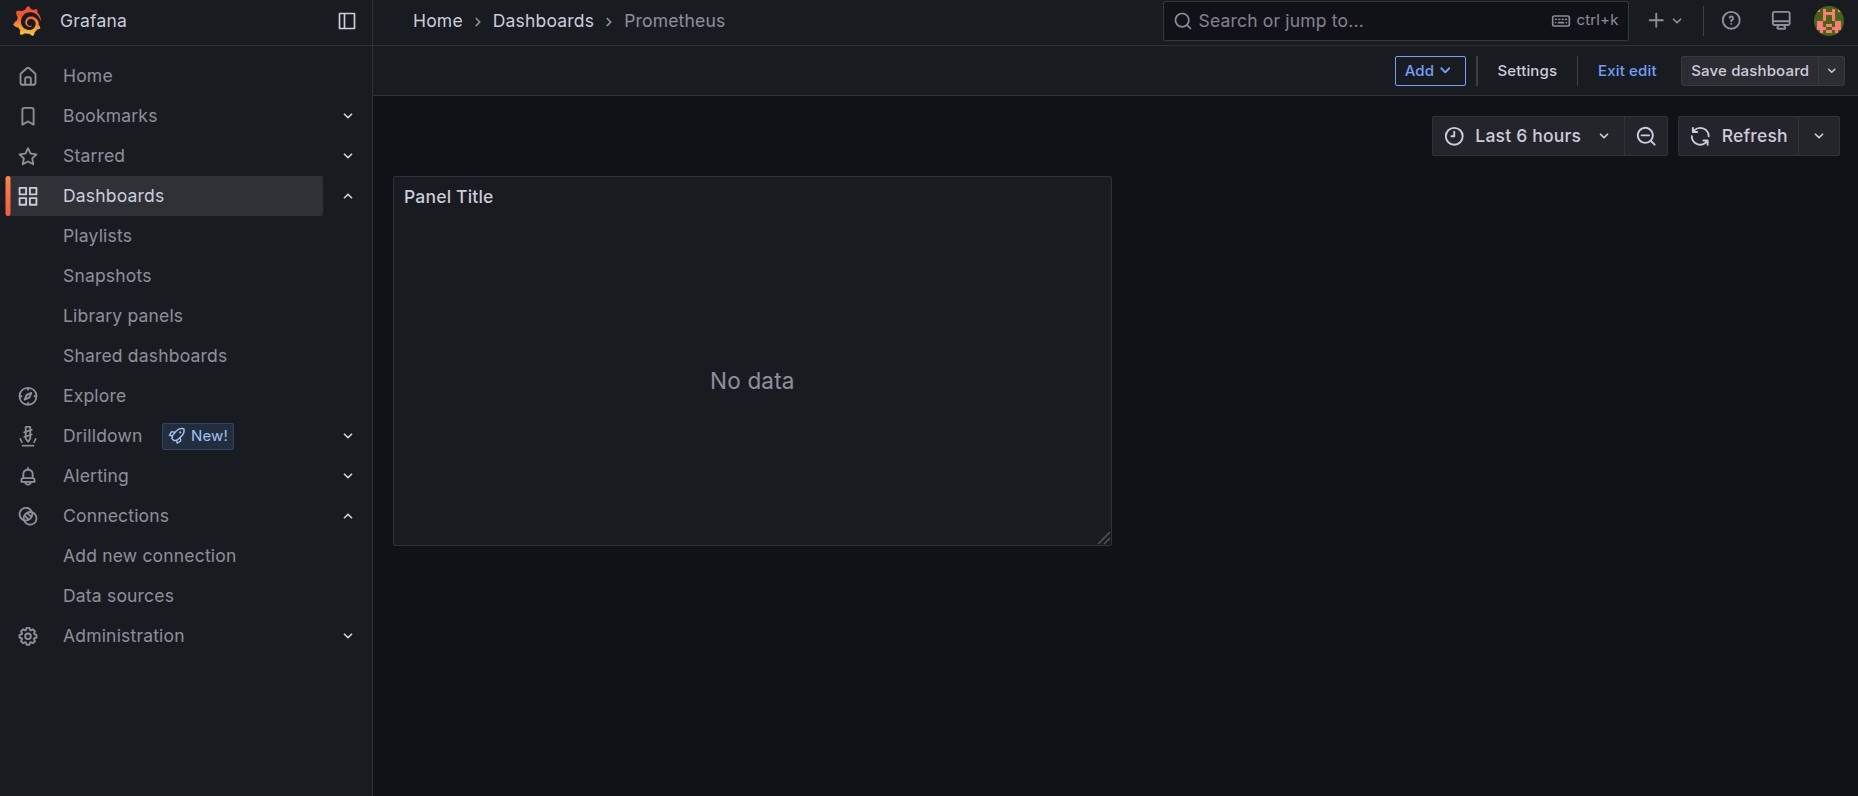
Add a panel and configure it to use Prometheus as the data source.
Use PromQL queries to visualize key metrics (CPU usage, memory consumption, disk IO, etc.).
Set up alerting rules to receive notifications when thresholds are exceeded.
Benefits of Using Prometheus and Grafana
- Real-time monitoring: Continuously track server performance and detect issues early.
- Scalability: Handle thousands of metrics efficiently across distributed systems.
- Customization: Tailor dashboards and alerts to specific business needs.
- Cost-effective: Completely open-source with no licensing costs.
Conclusion
Prometheus and Grafana are essential tools for anyone looking to monitor server performance effectively. Whether you’re managing a small deployment or a large-scale cloud infrastructure, these tools provide powerful insights to maintain system health and optimize performance. By setting up Prometheus for data collection and Grafana for visualization, you can create a robust monitoring solution that enhances reliability and operational efficiency.