How to Install Kubernetes Dashboard (GUI) in Your Cluster
Leave a comment on How to Install Kubernetes Dashboard (GUI) in Your Cluster
Kubernetes is an advanced container orchestration platform, but operating it via the command line may be difficult, particularly for novices. The Kubernetes Dashboard is a simple web-based GUI that allows you to monitor and manage your cluster effectively. This guide will walk you through the steps of installing and using the Kubernetes Dashboard in your cluster.
Requirements
- A running Kubernetes cluster
- Install and setup kubectl CLI to interface with your cluster.
- Administrative access to deploy and manage resources in the cluster
Step 1 – Deploy the Kubernetes Dashboard
To install the Kubernetes Dashboard, apply the official YAML manifest:
kubectl apply -f https://raw.githubusercontent.com/kubernetes/dashboard/v2.7.0/aio/deploy/recomme nded.yaml
This command deploys the essential components, such as the dashboard UI, metrics server, and associated configurations.
Step 2 – Create an Admin Service Account
By default, the dashboard has limited permissions. Create a service account with cluster-wide administrative privileges to completely access and control the cluster.
Create a new YAML file (for example, admin-service-account.yaml) containing the following content:
apiVersion: v1
kind: ServiceAccount metadata:
name: admin-user
namespace: kubernetes-dashboard
—
apiVersion: rbac.authorization.k8s.io/v1 kind: ClusterRoleBinding
metadata:
name: admin-user roleRef:
apiGroup: rbac.authorization.k8s.io kind: ClusterRole
name: cluster-admin subjects:
– kind: ServiceAccount name: admin-user
namespace: kubernetes-dashboard
Apply this configuration:
kubectl apply -f admin-service-account.yaml
Step 3 – Retrieve the Access Token
Once the service account is created, retrieve its access token to authenticate with the dashboard:
kubectl -n kubernetes-dashboard create token admin-user
Copy and save the token as you will need it to log in to the dashboard.
Step 4 – Access the Kubernetes Dashboard
To access the dashboard, start a proxy server:
kubectl proxy
Now, open the following URL in your browser:
http://localhost:8001/api/v1/namespaces/kubernetes-dashboard/services/ht tps:kubernetes-dashboard:/proxy/
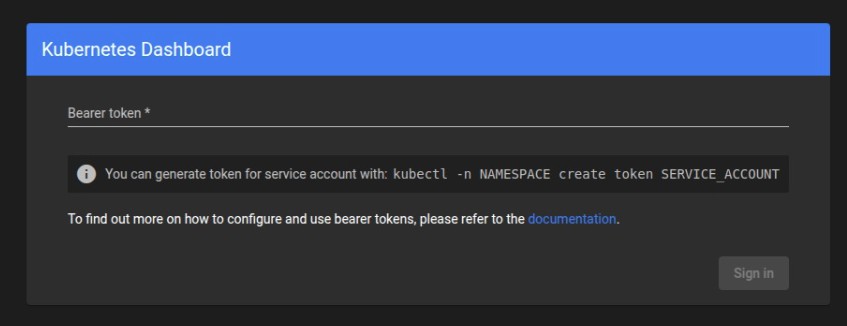
Step 5 – Log in to the Dashboard
When prompted, select the Token authentication method and paste the token retrieved earlier. Click Sign In to access the dashboard.
Conclusion
The Kubernetes Dashboard simplifies monitoring and managing your cluster by making it easy to deploy applications, inspect logs, and control resources. These instructions mentioned above will allow you to safely configure and access the dashboard in your Kubernetes system.