rtop – A Tool to Monitor Linux Servers Remotely
Leave a comment on rtop – A Tool to Monitor Linux Servers Remotely
Introduction
Monitoring the health and performance of Linux servers is crucial, especially for remote server management. rtop is a lightweight yet powerful tool designed specifically for this purpose.
This guide will cover:
- What rtop is
- Its key features
- How to install and use it
- Its benefits for server administration
What is rtop?
rtop is a simple, agentless, real-time monitoring tool for remote Linux servers. It provides a clear summary of crucial server metrics, including CPU, RAM, disk activity, and network traffic.
Unlike other monitoring tools that require complex setups, rtop is designed to be lightweight and easy to use.
Key Features of rtop
- Agentless Monitoring
rtop does not require any agents to be installed on remote servers. It collects data securely via SSH, making it simple and secure. - Real-Time Updates
Provides live monitoring of server health, allowing administrators to quickly detect and address issues. - Cross-Platform Compatibility
Works on any Linux distribution, making it highly flexible. - User-Friendly Interface
Displays essential metrics in a clear, easy-to-understand format. - Lightweight
rtop has a minimal resource footprint, ensuring it does not burden the monitored server.
How to Install rtop
Installing rtop is a simple process and requires Go (Golang) to be installed first.
Step 1: Install Go
Since rtop is written in Go, you need to install it first.
Download the Go package:
wget https://go.dev/dl/go1.22.5.linux-amd64.tar.gzExtract the downloaded package:
tar -C /usr/local -xzf go1.22.5.linux-amd64.tar.gzAdd Go to your environment variables:
vi ~/.profileAdd the following lines inside the file:
export GOPATH=$HOME/go
export PATH=$PATH:/usr/local/go/bin:$GOPATH/bin
Apply the changes and verify the installation:
source ~/.profile
go version
Step 2: Install rtop
Once Go is installed, install rtop using the following command:
go install github.com/rapidloop/rtop@latestStep 3: Run rtop
To start monitoring a remote server, use:
rtop user@remote-serverEnsure you have SSH access to the remote server.
Monitoring Metrics with rtop
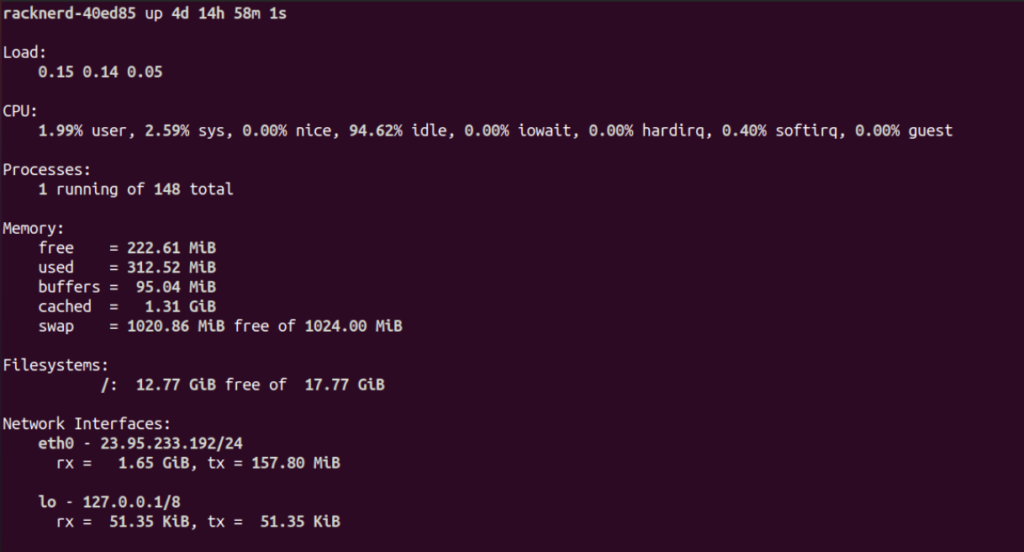
Once rtop is running, you can monitor the following metrics:
- CPU Usage
Displays CPU utilization percentage, helping you identify high-resource-consuming processes. - Memory Usage
Shows used, free, and total memory, allowing you to track memory leaks or shortages. - Disk Activity
Provides information on disk I/O operations (read/write), useful for detecting bottlenecks. - Network Traffic
Tracks inbound and outbound network traffic to monitor load and potential issues.
Conclusion
rtop is a lightweight, agentless monitoring tool that provides real-time insights into Linux servers. It strikes the perfect balance between ease of use, efficiency, and real-time data.
By integrating rtop into your server management toolkit, you can:
✅ Enhance monitoring capabilities
✅ Maintain a reliable server environment
✅ Ensure peak performance
✅ Detect potential issues quickly
For administrators managing multiple servers, rtop is an invaluable tool for maintaining system health and performance.